I attended the Precision Metalforming Association’s(PMA) 2018 Economic Outlook presentation by William A. Strauss on February 23, 2018. William is a Senior Economist and Economic Advisor at the Federal Reserve Bank of Chicago.
It is worth it to note that this presentation was delivered before the Section 232 announcement of tariffs on steel and aluminum imports to the United States on March 1st, 2018 by President Donald Trump. These tariffs between 10% and 25% could have a significant impact on the forecasted projections.
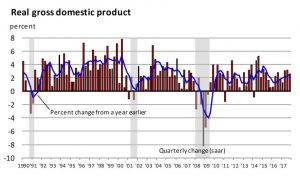
In 2017, the United States Real Gross Domestic Product(GDP) expanded by 2.5%. The Midwest economy is growing above trend in-line with the national economy. The Federal Open Market Committee (FOMC) is predicting the GDP to grow just above trend in 2018 and then with trend in 2019 & 2020. With the GDP expanding we saw the real value of the stock market reaching new highs.
While we are seeing the expanding GDP and stock market highs, we are also seeing a restrained recovery path of the Business Cycle compared to previous deep recessions. Recovery from both the 1974-75 and 1982-82 recessions saw an average annualized growth of 4.3%, while we are currently seeing an average annualized growth of 2.2%. Even with a lower average of annualized growth compared to previous deep recessions we are still seeing a low probability of a recession within the next two quarters. A growing GDP is an important indicator for the steel makers. An expanding GDP is illustrating a positive demand for the automotive industry, energy sectors and construction industry.

Source: William Strauss – Federal Reserve Bank of Chicago
The Composite Index of the 10 Leading Economic Indicators continue to rise. The leading economic indicators usually change before the economy as a whole changes. They are therefore used as a short-term predictor of the economy. For example, S&P 500 Stock Index returns are a leading indicator. We will see the stock market rise before we see the economy recover from a slump and vice versa. Another leading indicator is Manufacturing and Trade Inventories and Sales which is a primary source of information on the state of business inventories & sales.
The United States employment increased by over 2.1 million jobs over the past year while the nation’s unemployment rate has fallen to 4.1%. With the increase of employment and the falling unemployment rate we are still seeing a significant number of unemployed Americans for more than 27 weeks. Illinois ranked below the United States as whole? Or compared to other states? as well as Iowa, Michigan, Wisconsin and Indiana in regards total employment change from the year prior. Illinois’ unemployment rate is .7% above the national rate. Wages and benefit costs continue to increase at a very slow rate. Slow productivity growth helps explain why even though we have seen a relatively strong employment increase we are not seeing that translate to higher wages.
When analyzing the inflation rate, the FOMC finds that the core personal consumption expenditures(PCE) inflation rate remains low. Core PCE inflation is when volatile components such as food and energy are removed. The FOMC predicts that the core personal consumption expenditure inflation rate will be around it’s target of 2%.

As for housing, the Blue Chip Housing Starts forecast calls for a continuation of the gradual recovery in housing. The 2017 actual figure was 1,207,000 housing starts in 2017. They are forecasting 2018 to have 1,279,000 housing starts and 2019 to see 1,328,000 housing starts. Housing starts are the beginning of construction on a new house and is used as an economic indicator. Structural steel will see a rise when we see a rise in housing starts.
We are seeing manufacturing output increase after being stagnant the past couple years. As manufacturing output is increasing we are still seeing capacity utilization (manufacturing) stay below full capacity, though moving higher the past year. These trends have led manufacturing employment to increase by 186,000 workers over the past 12 months. The Midwest Economy Index’s manufacturing component is above trend and performing well above that of the nation. This is leading to manufacturing job growth in the Midwest performing above the US.

Light vehicle sales saw record numbers in 2016 but in 2017 we saw a slight dip of 1.4%. Continuing with the trend we saw light truck sales increase by 5% and passenger car sales were 11.4% lower. Alternative power vehicles, including hybrids, hold a very low market share of total sales. Blue Chip Light-Vehicle Sales are forecasting lower. 2017 saw 17,100,000 sales and 2018 is forecasting 17,000,000 with 2019 projecting 16,700,000 sales. US Aluminum foundry alloy premiums rely heavily on demand of the US automotive industry. The premiums started to slow at the beginning of 2018 but demand from large automakers is said to be sustaining the market. Aluminum sheet capacity is poised to grow in 2018.
The industrial sector saw strong output growth over the past several months. We are seeing supply managers’ composite index grow vastly over the past year. Chicago saw a significant reporting increase over the national average. While industrial production is forecast to improve it is likely to improve below it’s historical rate this year.
The Federal Reserve has raised the Federal Funds rate by 1.25% since December 2015. The Federal Reserve’s balance sheet has been flat for the past several years but the Fed began to reduce it in October of 2017. Reducing the balance sheet is considered, “Policy Normalization”. We can expect to see the Fed rate rise to ‘normal levels’ while security holdings are sold off the balance sheet. This is a sign of the Federal Reserve believing in the strength of the US economy since it slashed interest rates to almost 0% in 2008-2009.
Head to www.BLDUKE.com for a list of services, a quote or to schedule a pick up. Follow B.L. Duke on Twitter, Facebook and Instagram for news and market updates in the steel and scrap metals industry.

